
Our mission at Edlink has always been to improve the quality of education through the use of technology. We envision a world in which the story of a student's educational experience can be summarized and visualized cleanly and simply. This way, anyone involved in that student's development can quickly and effectively meet that student where they are.
Today, we're driving that mission forward in a big way.
Our engineering team has been hard at work designing and implementing 15 new models that cover six key areas: Extended Rostering, Behavior, Attendance, Facility Management, Calendars, and Transportation.
This update represents the single largest change to our API and data model since the launch of Edlink and we're really excited to see how developers use this new data to improve their platforms and the lives of students around the world.
API Updates
- Added 15 new models to the API:
- Extended Rostering:
Departments,Subjects,Periods,Incidents - Behavior:
Incidents - Attendance:
Meetings,Attendance - Facility Management:
Facilities,Rooms,Assets,Fees - Transportation:
Stops,Routes,Vehicles - Calendars:
Calendars,Days
- Extended Rostering:
- Added approximately 30 new API endpoints to support the new models.
- Updated a number of existing models to include new fields and relationships.
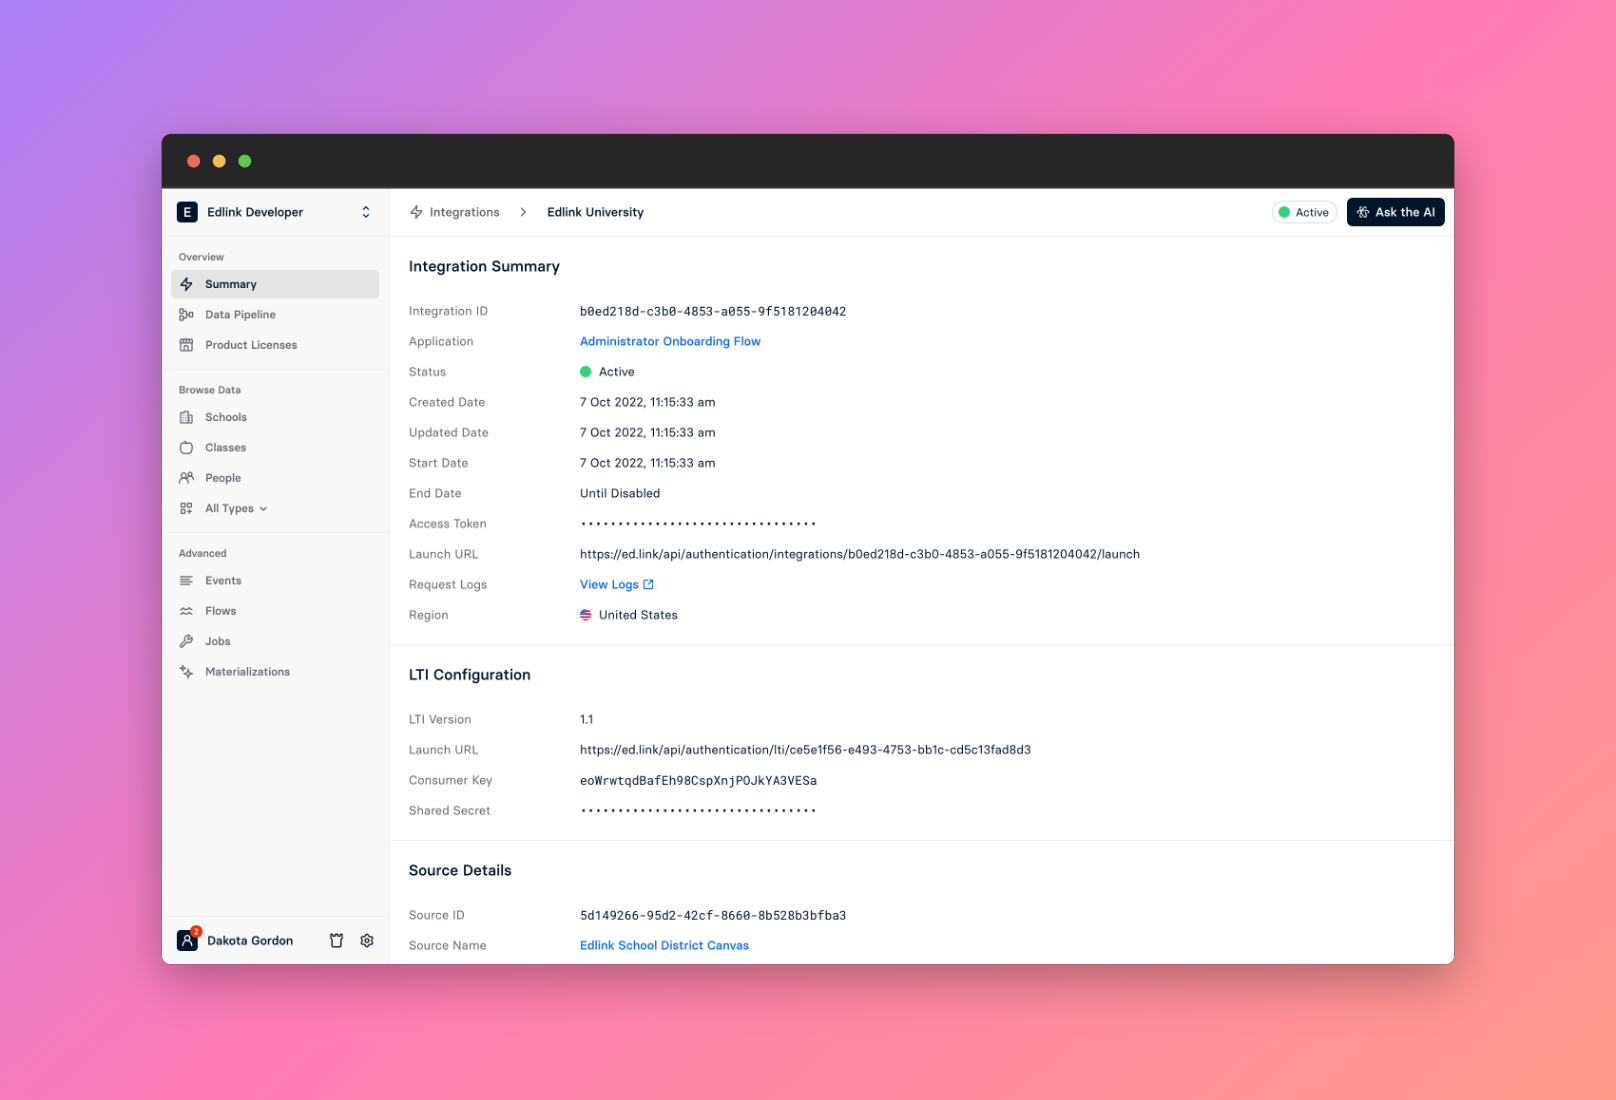
Dashboard Updates
- The most obvious change is that we've adjusted the color of the left-hand sidebar and the navigation links.
- The navigation has now changed to be context-specific. That is, the navigation options will now change depending on your page within the dashboard.
- This new navigation scheme was created for two reasons: There were getting to be too many horizontal tabs; and the sidebar was a poor use of valuable space that we wanted to reclaim in order to de-clutter our data views.
- We've added breadcrumbs to the top bar to help you navigate back to where you came from.
- We're making improvements to our data tables (as there are many) to make them more readable and organized. Expect to see more changes around these elements in the future.
- You can now preview all types of data in the dashboard, including our new models. You used to only be able to preview a handful (e.g. schools, people).
- Product Licenses and Data Pipeline have been split into their own tabs. This is to make room for more features coming in the near future.
- The Data Pipeline preview fits more seamlessly into the overall UI now and will observe forward and back buttons on your browser.
- Updated the API documentation and the Postman collection to include the new data models and API endpoints.